

How many devices do you own that can track some form of health data? In today’s world, health tracking has become second nature, thanks to the myriad of watches, straps, bands and all sorts of gadgets that ‘health conscious’ consumers often wear. Behind the ‘step count’ that we all love to compare with friends after a hefty hike, the most common health metric many of us track consistently is our heart rate. With so much information in circulation about Heart Rate ‘Zones’, Heart Rate Variability, and all things fitness tracking, that thumping in your chest quickly becomes more meaningful than just the number you check when you start breathing heavily.
While there is an immense amount of data surrounding what our heart rates tell us, there seems to be an equal number of questions that many of us are left with about all these numbers our devices provide:
What are the Zones of Training?
Which Zone is Best?
What do the Zones Actually Represent?
Does it Matter if You’re a Runner v. Cycler?
What if You Just Want to Exercise for General Health?
Lucky for you, these are the exact questions we’re tackling in today’s blog. So kick back, relax, and try to stay in ‘Zone 1’ for the next couple minutes ;).
HEART RATE ZONES ARE… WRONG?
As fitness enthusiasts and ‘wannabe’ scientists, it’s always important to define the terms we use so we’re all on the same page. Regardless of which ‘zone’ you’re in, a heart rate zone can be thought of as a predetermined range that is meant to indicate a certain level of exercise intensity. Now, before we dive into all the fun numbers, figures, and ultra-mega-sciencey proxies for exercise intensity, a quote from (jacked) George Box feels relevant to discuss:

‘All models are wrong. But some are useful.’
By classifying our exercise intensity into ‘zones’ we are simplifying what is going as our body responds to exercise. If a certain heart rate zone is between 100 and 120 beats per minute (BPM), what happens at 99 bpm? Or 121? Are those really all that different? Hopefully, the critical tone in my writing is coming through loud and clear. So what’s the point of using these models if they’re so ‘wrong’?
We’re using a model to help make sense of how to most efficiently train! Like our buddy George just told us, this model is wrong, but useful. We’re able to take research data so we can determine the ‘best fit’ cut-off points to use for heart rate tracking. Regardless, it’s important to acknowledge that there will be some wiggle room associated with these numbers!
HOW TO CALCULATE THIS SH*T:
Heart rate zones are generally based on one of two different measurements. Your Maximum Heart Rate (HRMax) or your Heart Rate Reserve (HRR). HRMax is pretty self explanatory: how fast does your heart have the capacity to beat? This is often calculated using a very simple equation:
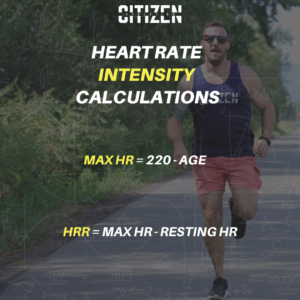
MaxHR = 220 – AGE (years)
For today’s purposes, we will use HRMax in most of our calculations simply because it is easier that way. BUT, for anyone who likes the deep dive material – keep reading. Your Heart Rate Reserve (HRR) is a more ‘true’ measure of exercise intensity. How? By using HRR, you’re better able to align your percentage of exercise intensity with your percent-change of heart rate.
If you were a 40 year old with a resting heart rate of 70 beats per minute (bpm), your maximum heart rate would be 180bpm, but at ‘rest’ (aka – no exercise at all), 70 bpm is close to 40% of your maximum heart rate. In this scenario, our ‘exercise intensity’ would be 0%, but our %HRMax is already at 40%.
The beauty of using HRR, is that the percentage aligns exercise intensity with Heart Rate; 0% exercise intensity, is the same as 0% HRR. This calculation is still quite simple:
MaxHR – Resting HR = HRR
HRR can be a helpful tool to more effectively track various inflection points once exercise intensity increases to a point that our body has an exponential, as opposed to linear, reaction. Okay, now that I’ve lost about half of you reading, lets jump into how we differentiate the different zones of training.
HEART RATE ZONES: A 30,000-FOOT VIEW:
Heart rate zones are important if you’re looking to take your fitness seriously. Similar to the notion of using HRR, Poole et al attributes the importance of transitions between heart rate zones to be ‘one of the main determinants of endurance performance.’
So, what are the heart rate zones and how do we really determine them? Generally speaking, there are two overarching models of heart rate zones; the Three Zone Model, and the 5 Zone Model.
The three zone model places exercise intensities into 3 main categories (shocker, I know). Depending on who you ask, Zone 1 is generally classified as ‘low intensity’ aerobic exercise, which often circulates between 50 and 70% of your HRMax. This is a pace you could sustain for hours; often involving your Heart Rate response to long walks, or low intensity cycling. The top end of Zone 1 is where your body hits one of two separate ‘lactate thresholds.’ The first threshold (‘Lactate Threshold 1’) marks the beginning of your body using carbs/sugars (aka: Glucose/Glycogen) as an energy source.
Okay pause – what’s all this about Glycogen, Sugars, and fuel sources?? Let’s take a quick intermission for your mini metabolism crash course:
QUICK DETOUR: METABOLISM 101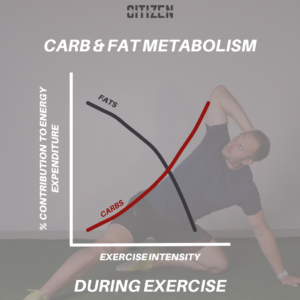
Let’s think about your body as a hybrid car; but instead of just having a supercharged battery with a gas guzzling V12 engine, it’s got a battery, engine, and a wicked turbocharger that really pushes the envelope. At low speeds we can go ‘all electric.’ Our body feasts on fat deposits that take a while to break down, but the rewards are certainly worth the wait. Because of the high volume of fat ANYONE has in their body (more on this another time), we’ve got enough energy to ride those suckers for miles.
BUT, once higher speeds are necessary, our 12 cylinder dodge hemi kicks into gear and our bodies start guzzling fast-acting fuel sources: carbs. Remember all those hours spent learning glycolysis in high school biology class? Those days may be coming back to haunt you. Fear not! There will be no call outs stating ‘pencils down’ during this quiz, BUT this stage does have an important indicator. Once we start to consume carbs, our body produces lactate, which is the first indicator of transitioning to Zone 2! Welcome to moderate intensity.
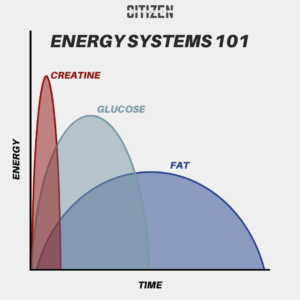
Finally, if red & blue lights pop up in the rear view and we’ve got to high-tail it outta there, our Turbocharger kicks in. At maximum intensities, we’re using all hands on deck combining carbohydrate breakdown, and creatine as a quick burst of energy. Yup, creatine! By breaking apart creatine molecules, our body can produce a truckload of energy, fast! That’s where our Zone 3 indicators turn on = exponential lactate production as a sign that we’re in deep.
Phew, okay – Metabolism DONE! What were we talking about again??
Right! Zone 2.
BACK ON TRACK:
In this zone, your heart is beating anywhere between 70-80% of its maximum capacity. Zone 2 is the classic ‘moderate intensity’ exercise; heavy breathing and sweaty pits are the result of a pace you could sustain for 30-60 minutes! After pas
sing your first lactate threshold, Zone 2 is the transition period between Lactate Threshold 1 and 2!
But now, it’s TURBO TIME!

Zone 3 is where we break through our second lactate threshold and hit speeds/intensities that we can sustain for only a matter of seconds! Our second threshold (Lactate Threshold 2) represents the point where we hit ‘all hands on deck.’ Our carbohydrate breakdown goes through the roof (ie – exponential increase) and we start to use everything we’ve got!
Alright, 3 Zone Model DONE! Got it all?
IS THERE ROOM FOR MORE?
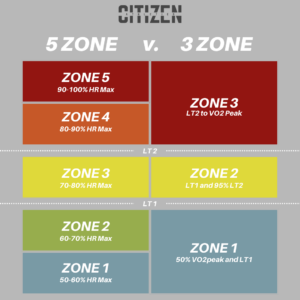
The 5 Zone Model simply expands on Zones 1 and 3 from the 3 Zone Model! A picture can say a thousand words, so why make the blog longer than it has to! Take a peek at this graphic showing the differences between the 3 Zone Model and 5 Zone Model of aerobic exercise.
So now that we’ve got the biology-review out of the way, how do we know what
Zone is best to train in? Or how we should track and program the time we spend in each zone?
Stay tuned as we answer these questions and more in Part 2 of this blog series!
ABOUT THE AUTHOR:
Dylan Carmody is a Doctor of Physical Therapy, and Strength & Conditioning Coach with 5+ years in the performance and rehab industries.
Having dabbled in training modalities like Olympic Lifting, Cycling, Powerlifting, and CrossFit, Dylan has a deep appreciation for all things performance, while still having a positive and fun-loving approach to exercise.
Dylan’s coaching experience is equally eclectic, ranging from performance coaching for elite athletes in the NCAA D1 setting, to group fitness and weight loss coaching in his early career.
With detailed exercise programming & consistent communication, he aims to create a training environment that is not only ‘tolerable’ for clients’ aches and pains, but truly helps to resolve their issues in the first place.
SOURCES:
- Bodner, M E, and E C Rhodes. “A review of the concept of the heart rate deflection point.” Sports medicine (Auckland, N.Z.) vol. 30,1 (2000): 31-46. doi:10.2165/00007256-200030010-00004
- Jamnick, Nicholas A et al. “An Examination and Critique of Current Methods to Determine Exercise Intensity.” Sports medicine (Auckland, N.Z.) vol. 50,10 (2020): 1729-1756. doi:10.1007/s40279-020-01322-8
-
Jones, Andrew M et al. “The maximal metabolic steady state: redefining the ‘gold standard’.” Physiological reports vol. 7,10 (2019): e14098. doi:10.14814/phy2.14098
-
Lamberts, Robert P, and Michael I Lambert. “Day-to-day variation in heart rate at different levels of submaximal exertion: implications for monitoring training.” Journal of strength and conditioning research vol. 23,3 (2009): 1005-10. doi:10.1519/JSC.0b013e3181a2dcdc
-
Poole, David C et al. “Critical Power: An Important Fatigue Threshold in Exercise Physiology.” Medicine and science in sports and exercise vol. 48,11 (2016): 2320-2334. doi:10.1249/MSS.0000000000000939
-
Poole, David C et al. “The anaerobic threshold: 50+ years of controversy.” The Journal of physiology vol. 599,3 (2021): 737-767. doi:10.1113/JP279963
- Watts, Sophie P et al. “Demarcation of Intensity From 3 to 5 Zones Aids in Understanding Physiological Performance Progression in Highly Trained Under-23 Rowing Athletes.” Journal of strength and conditioning research, 10.1519/JSC.0000000000004534. 17 Jul. 2023, doi:10.1519/JSC.0000000000004534